Dashboard
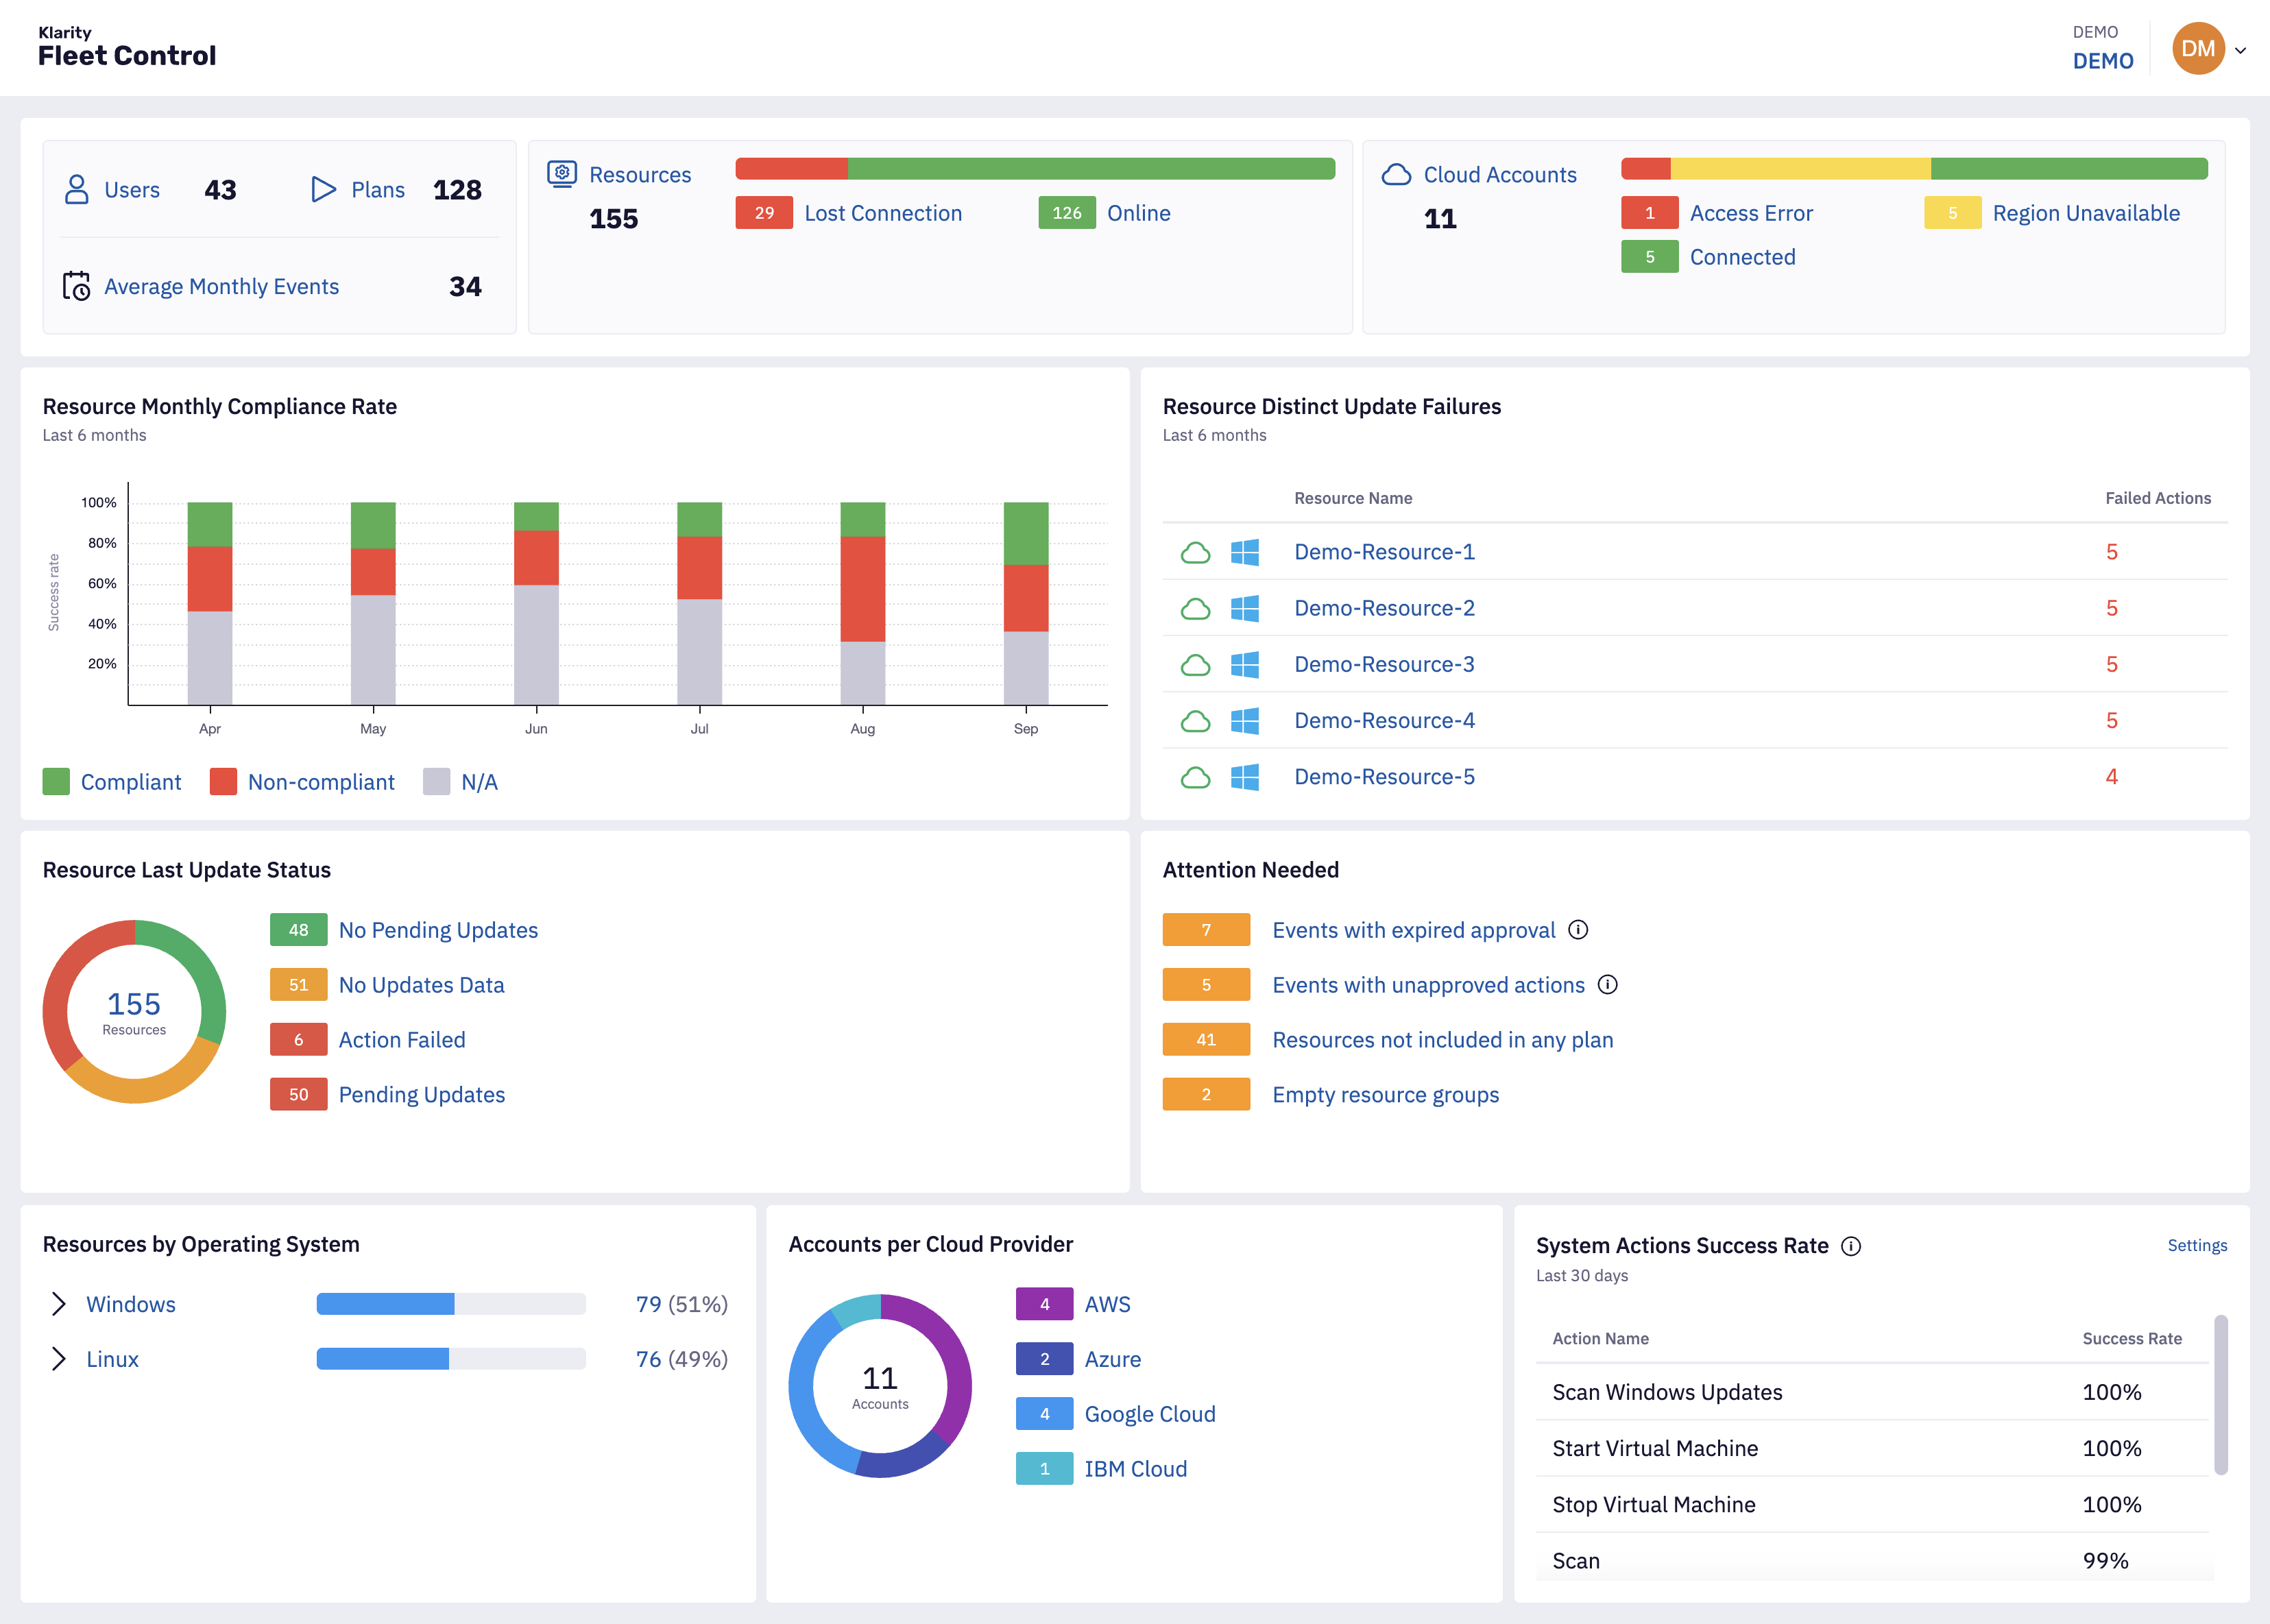
The Dashboard gives you an overview of your fleet: resources, cloud accounts, update compliance, failures, and items that need your attention. Most labels on the dashboard are links that open the related page with filters already applied.
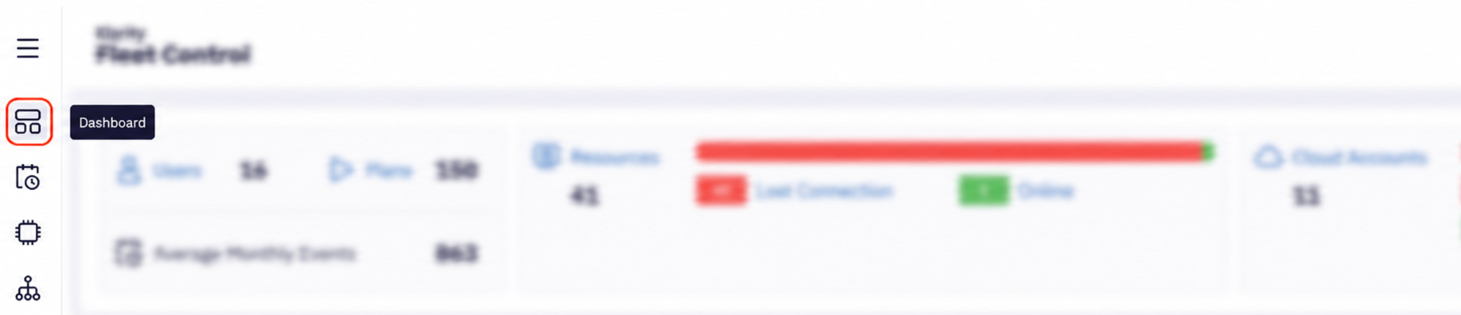
To get to the dashboard, go to the left menu and click Dashboard.
1. Summary
The top row shows the main totals for the selected customer:
- Users: Number of users who have access to the customer. Click it to open Users.
- Plans: Total number of plans. Click it to open Plans.
- Average Monthly Events: Average number of events per month since your first event.
- Resources: Total number of resources, split by connection status:
- Online: The resource is available.
- Lost Connection: The resource has lost connection or is unavailable.
- Cloud Accounts: Total number of cloud accounts, split by status:
- Connected: The account is connected and works as expected.
- Region Unavailable: Some of the specified regions are not accessible.
- Access Error: The credentials are invalid or expired, or none of the specified regions are accessible.
- Access Missing: The credentials to access the account are missing.
- In Progress: The account is being scanned.
Hover over a bar segment to see its count and percentage. Click a status label to open Resources or Cloud Accounts filtered by that status.

2. Resource Monthly Compliance Rate
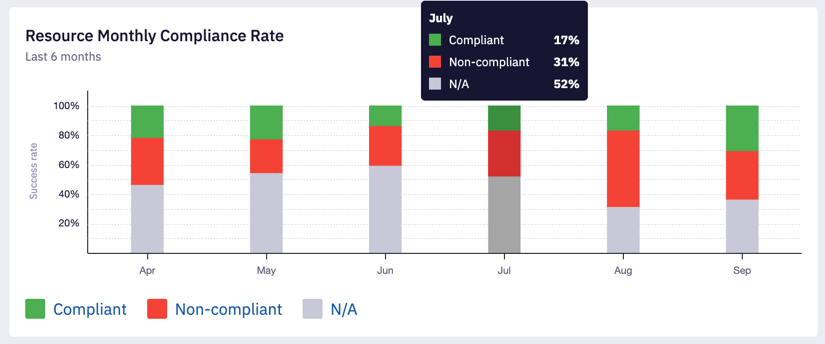
This chart shows the Compliance Status of your resources for each of the last 6 months, including the current month. Each bar shows the percentage of resources that were:
- Compliant: All required updates are successfully installed.
- Non-compliant: Updates are missing or failed to install.
- N/A: No successful
PATCHorSCANactions were detected during the month.
Hover over a bar to see the exact percentages for that month (rounded to 1%). Click a legend label to open Resources filtered by that compliance status.
3. Resource Distinct Update Failures
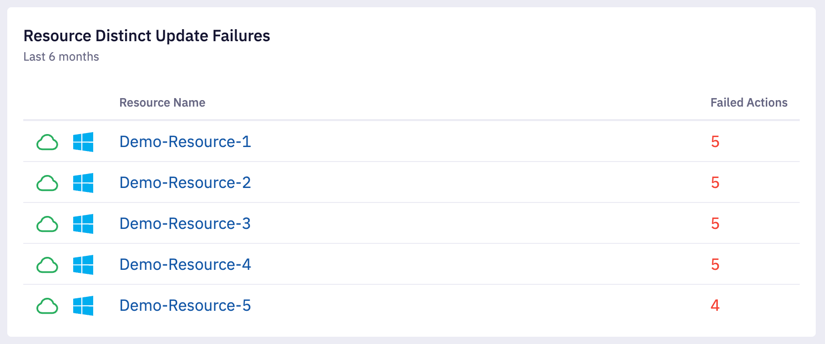
This table shows the 5 resources with the most failed patch actions in the last 6 months. If a failed action was retried, it is counted only once (a successful retry removes the failure from the count). Scan actions are not counted.
The icons next to each resource show its connection status and operating system. Click the resource name to open its details with the list of failed actions.
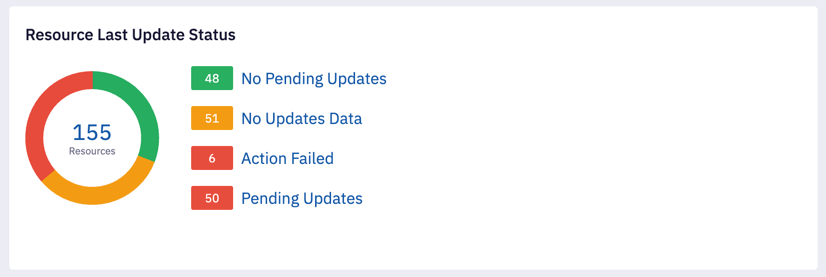
4. Resource Last Update Status
This chart shows the Last Update Status of your resources, which is the
result of the most recent SCAN or PATCH action on each resource:
- No Pending Updates: The last action was successful and no updates are pending.
- No Updates Data: There is no data about updates, for example because no action has run yet.
- Action Failed: The last action failed.
- Pending Updates: The last action was successful, but some updates are still available, failed to install, or need a reboot.
- Action In Progress: An action is running now.
Statuses with no resources are not shown. Click a status to open Resources filtered by that status.
5. Attention Needed
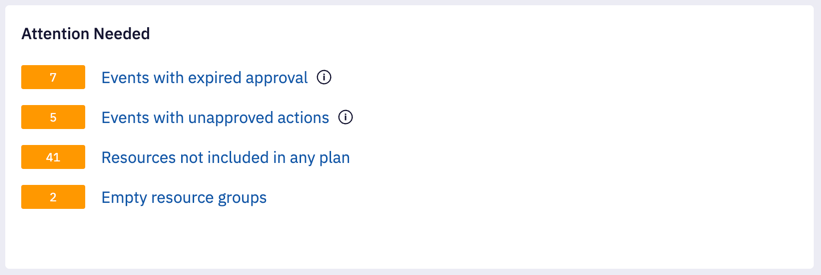
This list shows items that may need your action:
- Events with expired approval: Events with actions that were not approved in time.
- Events with unapproved actions: Events that are waiting for approval.
- Resources not included in any plan: Resources that no plan targets, directly or through a resource group.
- Empty resource groups: Resource groups with no resources and no dynamic rules.
Event counts are based on events that started in the last 30 days. Items with a count of 0 are not shown. Click an item to open the related page with the matching filters applied.
To learn how to approve actions, see Approving event actions.
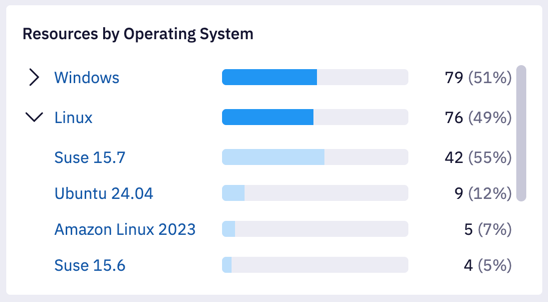
6. Resources by Operating System
This list shows how many of your resources run Windows and Linux. Click the arrow next to an operating system to see the split by distribution and version. Click any label to open Resources filtered by that operating system.
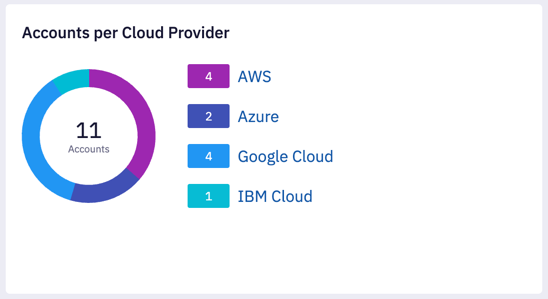
7. Accounts per Cloud Provider
This chart shows how many cloud accounts you have for each cloud provider. Click a provider to open Cloud Accounts filtered by that provider.
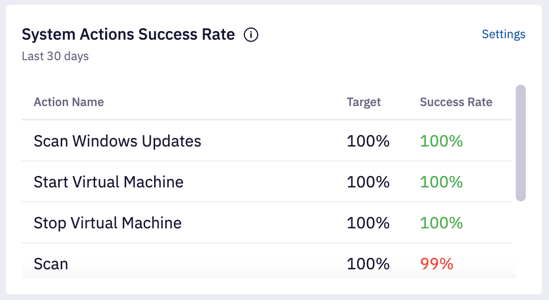
8. System Actions Success Rate
This table shows the percentage of successfully completed resource runs for each system action. The rate is based on individual resource runs. Retries are not counted.
If you set a target for an action, the success rate is shown in green when it meets the target and in red when it is below the target.
Configure the success rate
-
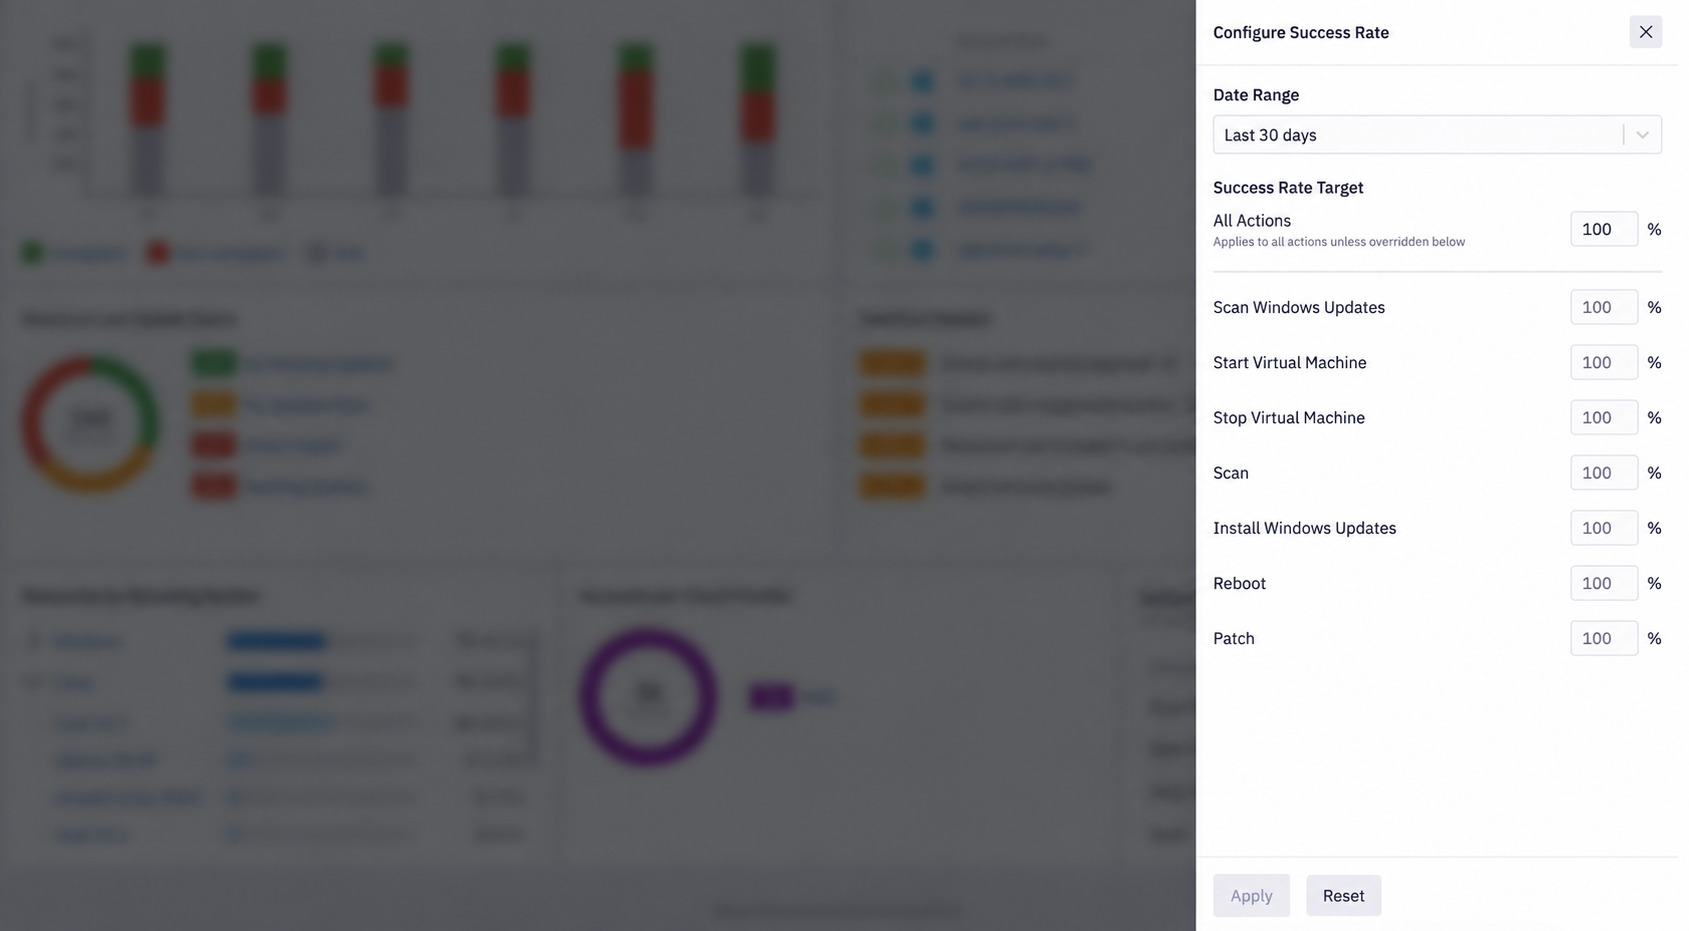
Click Settings.
-
Select the Date Range: last 7, 30, or 90 days.
-
In All Actions, enter a target that applies to all actions. Leave it empty if you don't need a target.
-
To use a different target for a specific action, enter it next to the action name.
-
Click Apply.
To go back to the default settings, click Reset and then Apply.
To change the success rate settings, you need the permission to update actions.